Right now, while you are reading this, your operation is generating a cost your P&L was never designed to show you. Industry data puts it at 10 to 15 percent of total revenue, lost to rework, delays, underutilized assets, and process failures that have been normalized simply because they repeat every day.
It is not a Leadership failure. It is a measurement gap. And until someone with the right methodology, Six Sigma consulting, walks through your operation and quantifies it, that number will keep compounding, invisible, uncontested, and expensive.
That is exactly what we do.
Here is what that looks like in practice:
Cost Reduction. Eliminate Waste. Deliver Measurable Results.
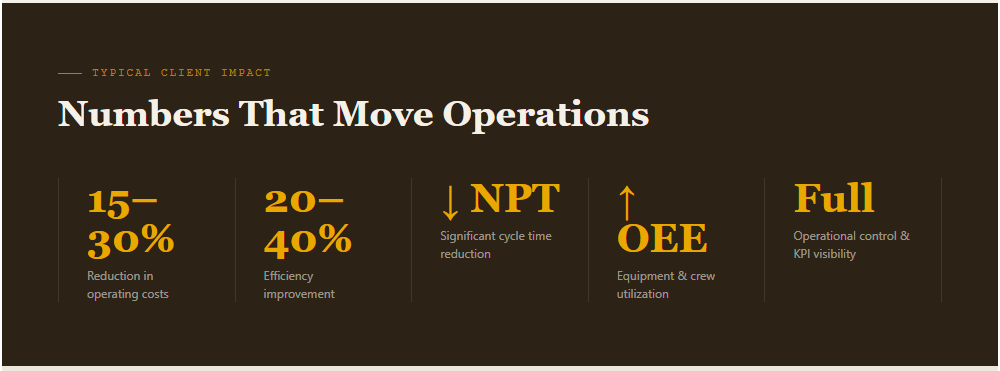
30%
Typical reduction in operating costs.
"Based on documented outcomes across Six Sigma engagements in high-cost operational environments."
40%
Efficiency & Process improvement across operations
100%
Results tied to measurable financial impact
What is Six Sigma
A Business Tool, not a Training Program
Six Sigma is a structured, data-driven methodology used to find and permanently eliminate the root causes of waste, inefficiency, and cost overruns inside your business processes.
It was developed at Motorola, proven at GE, where it generated over $12 billion in documented savings, and has since been applied across energy, manufacturing, logistics, healthcare, and field services worldwide.
What it means in practice: every process your operation runs has a hidden variation, hidden waste, and a hidden price tag.
Six Sigma is the system that finds the exact source, quantifies the cost, and fixes it permanently, with controls in place to ensure it does not return.
A Black Belt leads this process at the highest level of the methodology, cross-functional, statistically rigorous, and financially accountable at every step.

— The Problem
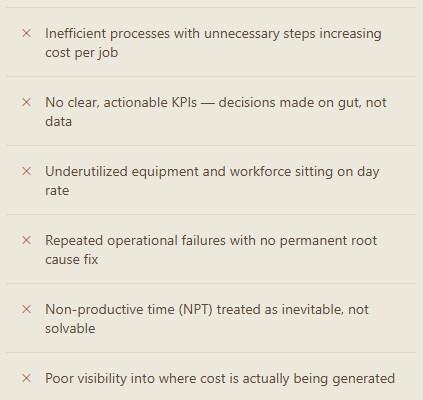
Where Margin Disappears
Most organizations are losing margin, not from one catastrophic failure, but from a thousand small inefficiencies compounding every shift, every job, every day.
In high-cost environments like energy, oilfield services, and industrial operations, the gap between what an operation could cost and what it does cost is often the difference between profitable and marginal.
The root cause is rarely the obvious one. That is exactly what we are trained to find.
"That is why an outside expert with the right methodology changes everything.”
— What Changes, Specifically, When We Fix Your Processes
Measurable. Permanent. Yours.
01 · Cost
Lower Cost Per Job
Reduce the cost per operation, per well, or per process cycle, not through budget cuts, but through smarter execution and planning.
02 · Efficiency
Improved Cycle Time
Eliminate bottlenecks, handoff delays, and rework loops that inflate time-on-task without adding value to the output.
03 · Utilization
Better Asset Utilization
Get more from the equipment and crew already on payroll. Idle assets and underutilized workforce are fixable process problems.
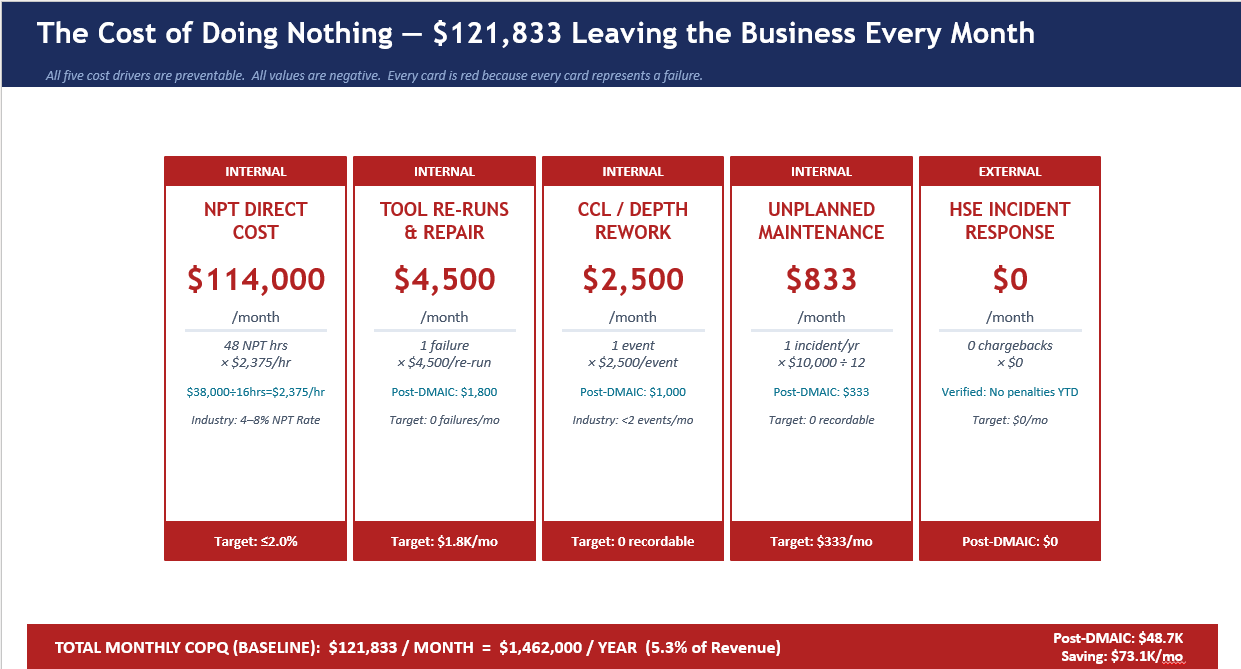
04 · NPT Reduction
Reduced Non-Productive Time
NPT is a symptom of systemic process failures. We find them, fix them, and put controls in place so they stay fixed permanently
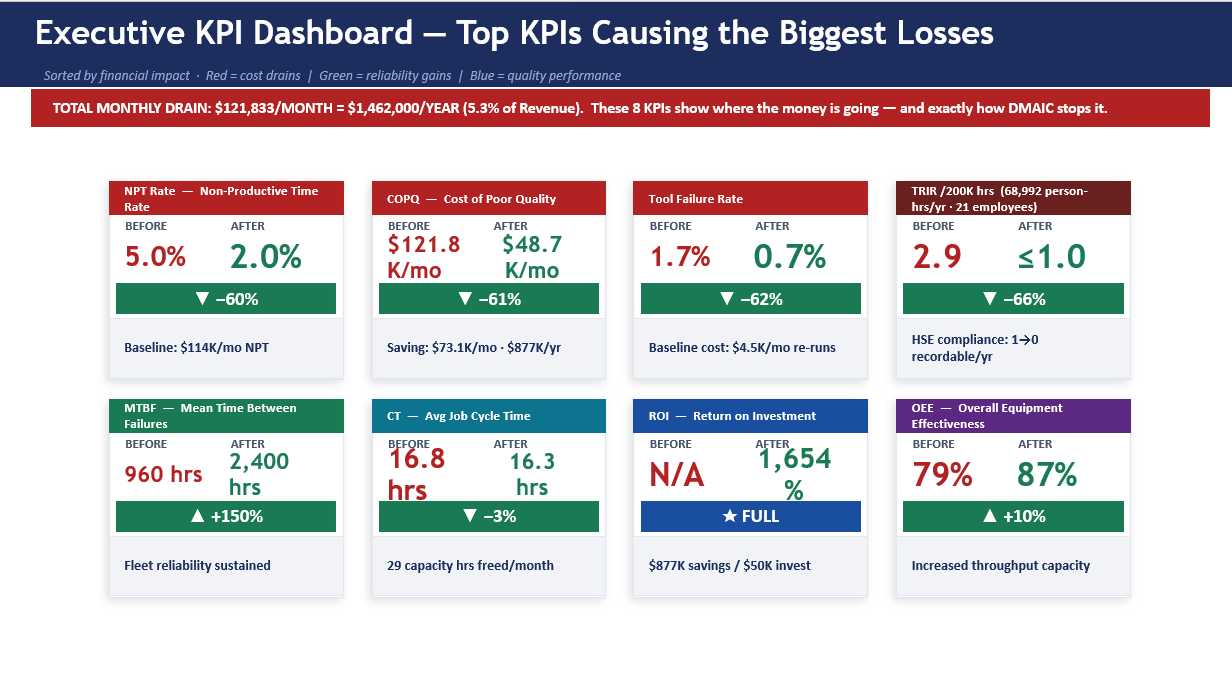
05 · Visibility
KPI Clarity
Actionable performance metrics your operations team can act on in real time, not lagging reports that arrive after the damage is done.
06 · Solutions
Permanent Root Cause Fixes
Stop treating recurring failures as acceptable variance. We identify the true root cause and implement controls that prevent recurrence.
— Industries Served
Built for High-Cost Operations
Whether you are managing a wireline crew, a manufacturing line, or a logistics network, the physics of waste are the same. We find it faster because we have worked in these environments ourselves.
This methodology was built for environments where a single day of inefficiency costs six figures. If your operation runs on tight margins, high day rates, or unforgiving uptime requirements, this is designed for you.
Energy & Oilfield Services
Technology & Software
Logistics & Supply Chain
Manufacturing & Production
Healthcare & Medical Operations
Upstream Drilling & Completions
Field & Industrial Services
Midstream & Downstream
Insurance Providers
Transportation
Sales and marketing
Financial
Business Analysis
Construction
Food Service Industry
And many more industries …
— The Approach
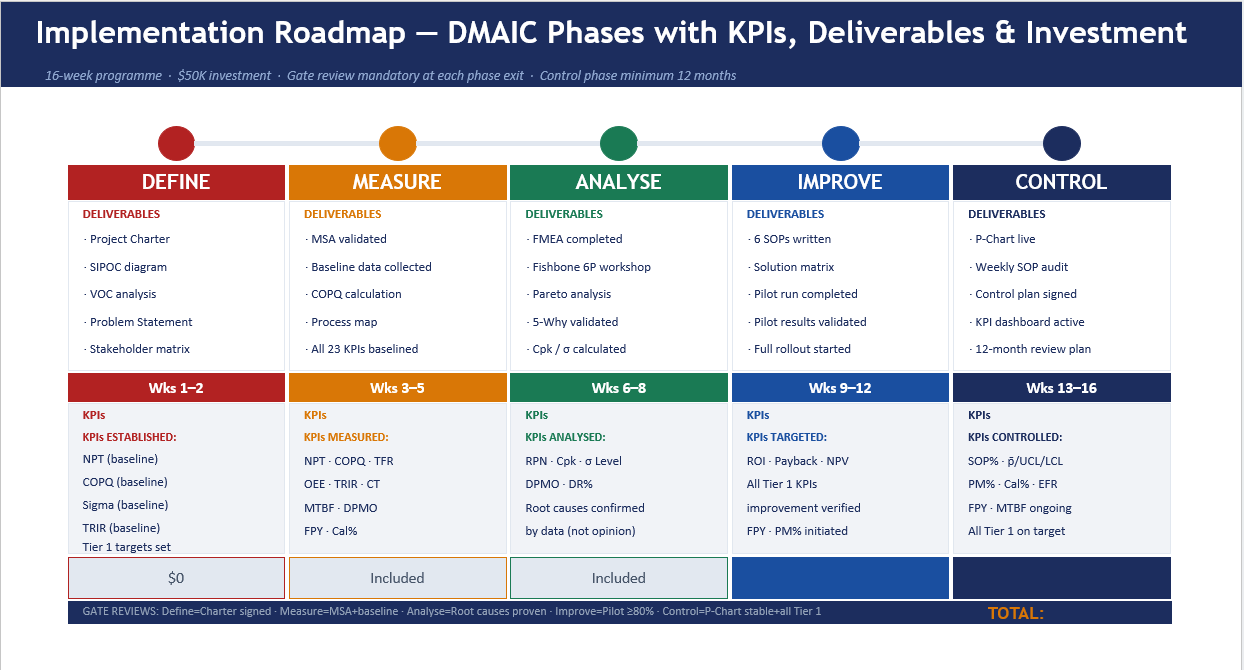
DMAIC — Structured. Proven. Relentless.
01 · Define
Quantify the problem and its direct financial impact. We establish exactly what inaction costs you before a single improvement is made.
02 · Measure
Map actual performance using real operational data. We work from verified fact, not assumptions, estimates, or field folklore.
03 · Analyze
Identify verified root causes through statistical rigor applied to real field conditions, so fixes address the source, not the symptom.
04 · Improve
Implement practical, field-ready solutions designed to work under real operational constraint, not just in a whiteboard session.
05 · Control
Lock in results with monitoring systems and process controls so improvements stick, and so you can measure them indefinitely.
— Why It Works
Not Theory. Engineering.
// Operational Experience
Built from the Field Up
This methodology is grounded in real engineering and operational experience, not academic frameworks retrofitted to industries we do not know. We understand day rates, NPT, wellsite logistics, and what mobilization actually costs.
// Execution First
Focused on Execution
Every recommendation is field-deployable. No slide decks delivered and forgotten. We stay until the improvement is live, measured, and confirmed with real operational data.
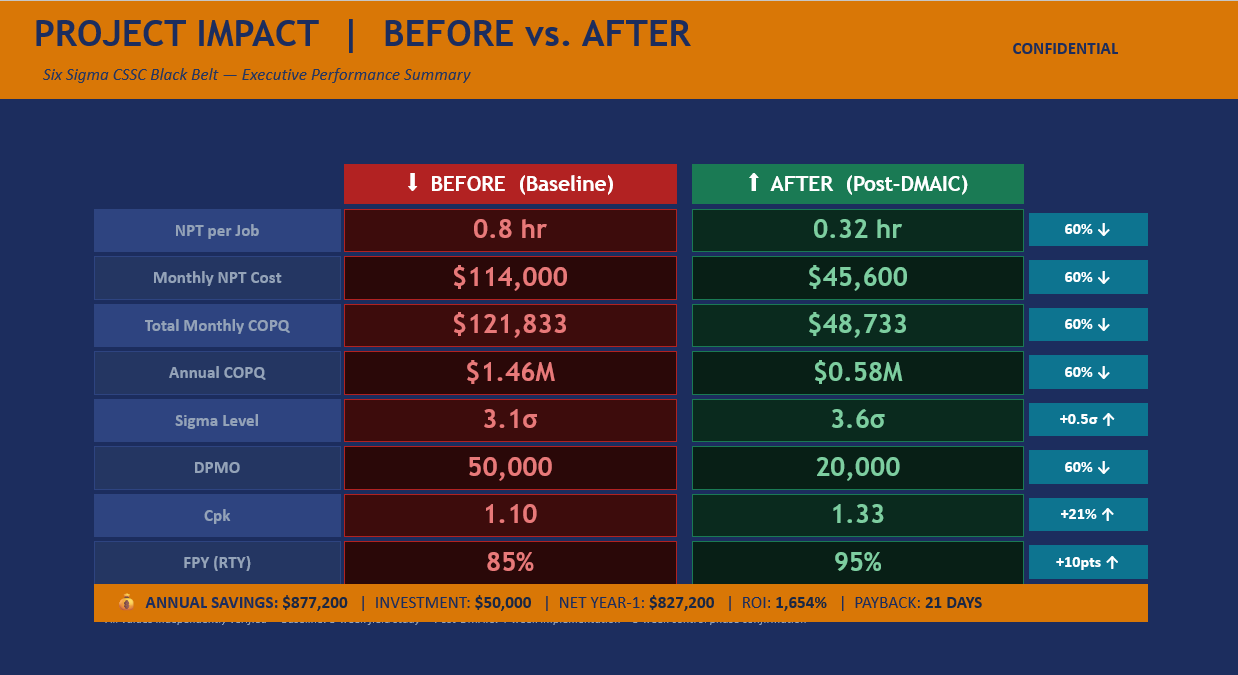
// Financial Accountability
Every Improvement Has a Dollar Value
We do not improve for the sake of improving. Every initiative is tied to a measurable financial outcome, cost reduction, time savings, or revenue protection. If we cannot quantify it, we do not chase it.
// High-Impact Environments
Designed for High-Cost Operations
We specialize in environments where the cost of failure, and the reward for improvement, is highest. High day-rate, high-complexity operations are where this approach delivers its largest returns.
Process Improvement in Action
// Cost Reduction · Oilfield Services
Reduced cost per job significantly by redesigning job planning and execution sequencing, eliminating avoidable rig time and crew waiting periods before jobs began.
// Root Cause Analysis · Operations
Eliminated a recurring operational failure blamed on equipment for 18 months. Root cause was a procedural gap, identified, corrected, and never recurred.
// Utilization · Field Services
Improved crew and equipment utilization by restructuring dispatch and mobilization workflows, same headcount, significantly more productive hours per shift.
// Process Efficiency · Industrial
Increased throughput by removing production bottlenecks, no capital investment required, only process redesign and structured KPI monitoring put in place.
— Limited Time Offer
When you schedule your free Operational Assessment before the end of this month, we will include a complimentary Operational Waste Snapshot, a written summary of your top cost-leak areas based on your intake information, delivered before our first session.
This gives you immediate, tangible value before any engagement begins, and lets you see exactly how I work before you commit to anything.
We review your current operations, identify key performance gaps, and outline immediate improvement opportunities, at no cost and no commitment required.
Every day your operation runs the same way is a day you're leaving money on the table.
Let's recover your hidden costs!
Book This Month - Get This Bonus
PROCESS IMPROVEMENT IN ACTION